Stock Market Real-Time Data Analysis Pipeline
Built an end-to-end real-time data analysis pipeline for stock market insights, leveraging technologies to process and visualize stock data dynamically.
Tools
Amazon Web Services (AWS) · Apache Kafka · Web Services API · Tableau · Data Pipelines
Tools
Amazon Web Services (AWS) · Apache Kafka · Web Services API · Tableau · Data Pipelines
Tools
Amazon Web Services (AWS) · Apache Kafka · Web Services API · Tableau · Data Pipelines
Timeline
4 weeks
Timeline
4 weeks
Timeline
4 weeks
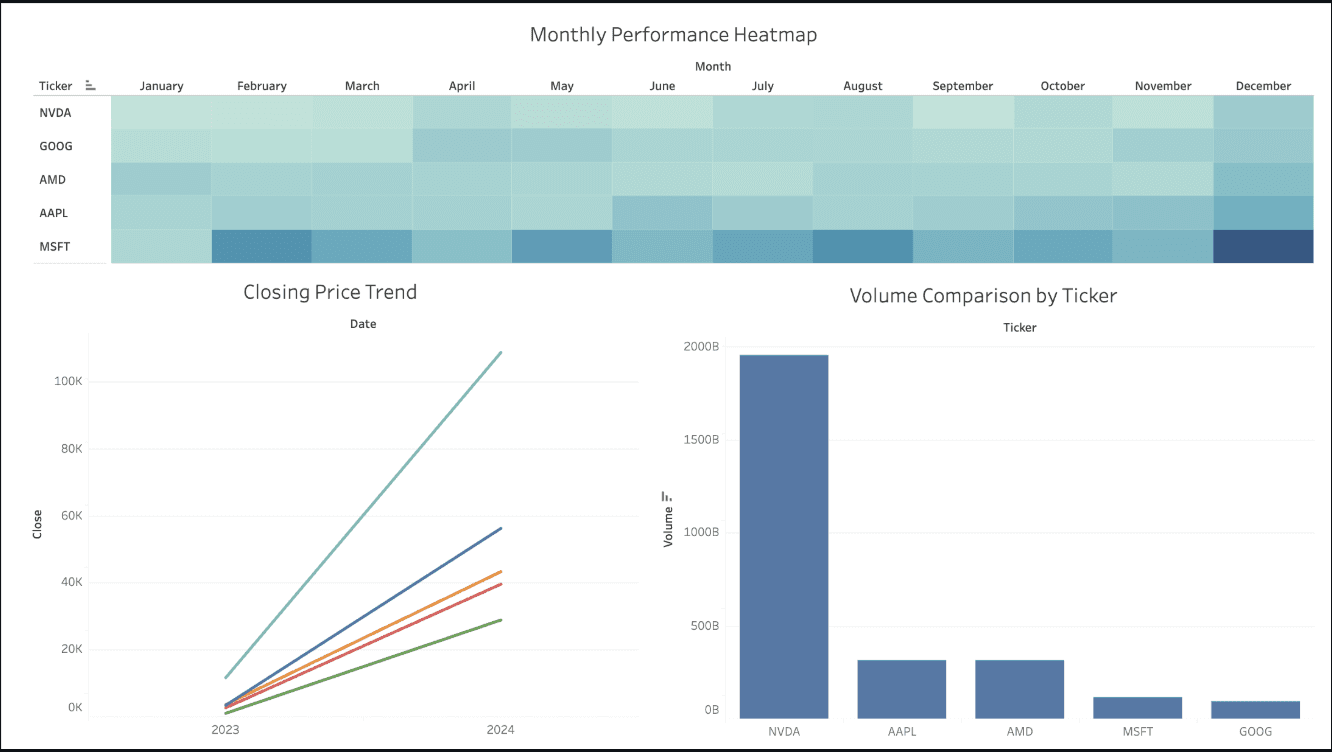
The pipeline begins with streaming live stock data using Apache Kafka and simulated feeds from the Polygon.io API. Ingested data is stored in AWS S3 and transformed through AWS Glue for efficient schema discovery and management.
Automated ETL processes were implemented using Python and orchestrated with Apache Airflow, enabling streamlined data workflows. Processed data is queried using Amazon Athena and visualized in Tableau through interactive dashboards designed to display key stock metrics such as price trends, trading volume, and performance indicators. The project supports continuous analysis and provides real-time insights into market behavior for widely followed stocks.


Reach out anytime
Let’s Stay Connected
Got questions or want to collaborate? Feel free to reach out—I'm open to new projects or just a casual chat!
yasawant@asu.edu
Reach out anytime
Let’s Stay Connected
Got questions or want to collaborate? Feel free to reach out—I'm open to new projects or just a casual chat!
yasawant@asu.edu
Reach out anytime
Let’s Stay Connected
Got questions or want to collaborate? Feel free to reach out—I'm open to new projects or just a casual chat!
yasawant@asu.edu